Synopsis:
Over the years, Magnetic Resonance Imaging (MRI) has become the optimal noninvasive method to quantify liver steatosis and to detect hepatic iron deposition. The conventional manual sampling technique of liver fat quantification at multiple regions is complex, inefficient and a time-consuming process. In addition, it may produce varying results for the heterogeneous fat deposition, which is prone to radiologist’s subjectivity. In this research, we propose a fully automated artificial intelligence (AI) based method for hepatic steatosis quantification and hepatic iron deposition detection using whole liver and spleen volume segmentation.
Summary:
The proposed AI-model is a powerful tool to automate the process of liver fat quantification for radiologists. It overcomes the traditional manual assessment limitations by increasing the quantitative reproducibility, and decreasing subjectivity related to radiologists.
Introduction:
Timely assessment of hepatic steatosis would be beneficial for patients, as the condition can be associated with Alcoholic Liver Disease (ALD) and Non Alcoholic Fatty Liver Disease (NAFLD). Elevated hepatic iron overload is another prevalent clinical condition that raises the risk of liver damage, and could be an early sign of a systemic iron overload condition that could also result in additional systemic complications. Magnetic resonance spectroscopy (MRS) and MRI-determined proton density fat fraction (MRI-PDFF) have become the reference standard for precise HS quantification[1,2]. However, using Dual-echo In-Phase (IP) and Opposed-Phase (OP) image acquisition techniques is still considered a non-expensive MRI technique to quantify Hepatic Steatosis (HS)[3]. This technique faces some limitations in quantifying liver fat in the presence of iron deposition. Moreover, differences in MRI scanners is another factor that can affect the absolute changes in relaxation times of the two echo signals, which may limit consistency among different scanners. Furthermore, manual sampling of corresponding IP and OP voxels at multiple ROI's at multiple regions across the slices is a tedious and time-consuming task. Automation may reduce variability in measurements otherwise due to subjectivity in radiologist chosen ROI's. In this study, we propose a fully automated artificial intelligence (AI) pipeline for liver fat quantification and hepatic iron deposition detection across the entire liver volume.
Methods:
The proposed system pipeline is composed of two different stages. In the first stage, we are using a modified 3D U-Net[4,5] architecture to segment the liver and spleen volumes from the OP modality, as illustrated in Figure 1. The segmentation dataset consists of 100 OP cases, with 25 cases respectively of four possible radiologist-graded degrees of fatty liver (Normal, Mild, Moderate and Severe). The liver and spleen voxels were manually annotated for generating the ground-truth masks.
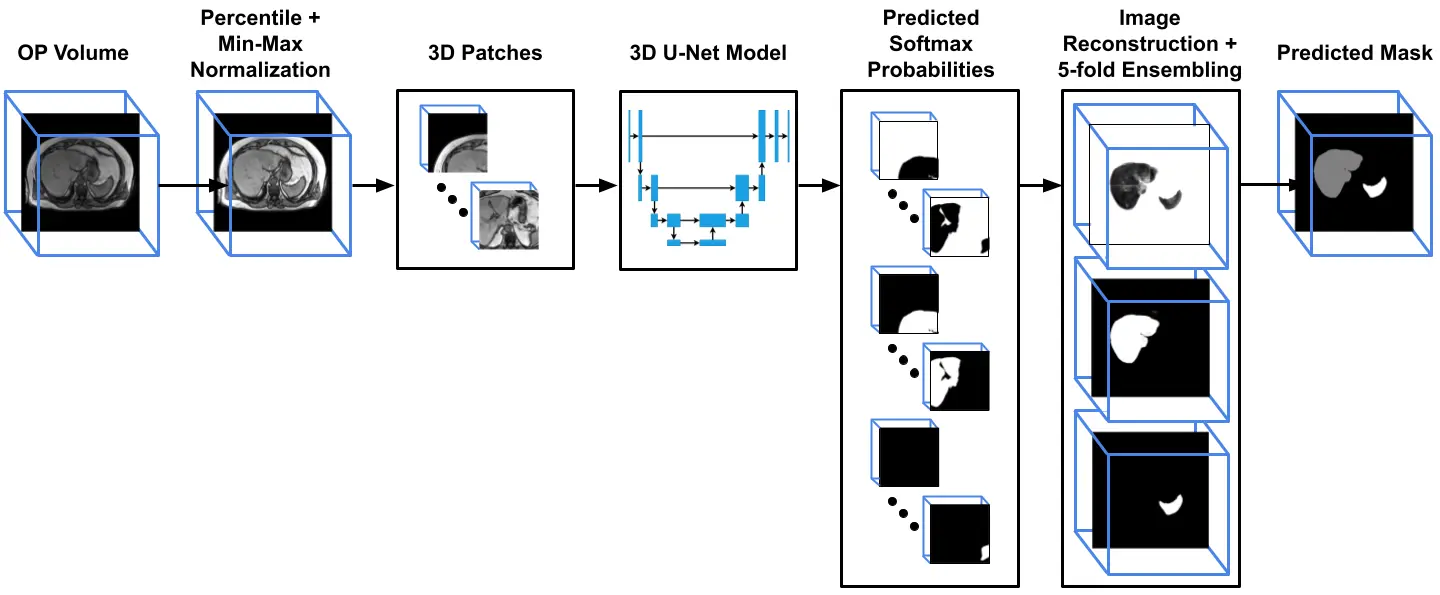
Figure 1: The liver and spleen volume segmentation pipeline. The input opposed phase (OP) is normalized and divided into overlapped patches. Each patch is inferred using 3D U-Net, and the predicted probabilities patches are reconstructed back according to their spatial location to generate the final prediction mask
The second stage was quantification in which the inferred segmentation masks were applied in the IP and OP sequences for whole-liver average signal intensity measurements. The conventional metric function for hepatic steatosis and iron deposition detection exploits the loss of signal intensity between the IP and OP imaging modalities for quantification. We redefine these metrics across the liver volume using four different metric parameters based on Fat Signal Fraction (FSF) and Dixon formulas [6,7,8], which are derived from the signal fraction formula $$$\frac{IP-OP}{2IP}$$$. In $$$Dixon_{H}$$$ formula, the average liver volume intensities is computed separately from IP and OP scans, while the average hepatic intensity in $$$FSF_{H}$$$ formula is computed after applying the signal fraction formula on the voxel-wise level of both scans (where negative values = 0). Alternative version of these formulas involving hepatic to splenic ratios, DixonH/S and FSFH/S, are more accurate metrics (compared to $$$Dixon_{H}$$$ and $$$FSF_{H}$$$), as they are internally-calibrated by the average signal intensity of the spleen. However, they cannot be used if the patient has a splenectomy or splenic hemosiderosis. From the FSF formula, we generated heatmaps, which provided visual illustration of steatosis diffuseness. We were also using two additional metrics for iron overload detection, which is valid in situations where the liver is not fatty. These metrics are derived from the relative signal intensity ratio (rSI) formula9 $$$\frac{OP-IP}{OP}$$$, which are rSIH and rSIH/S.We are applying a large study using 3539 dual IP and OP scans, which were previously assessed and graded for fatty liver by reporting radiologists. Both segmentation and quantification datasets were collected from 4 Siemens scanners. The box plots in Figure 2 illustrate the computed metric ratios from the AI model, and the relevant fatty liver severity classification by the radiologists. The overlapped score ranges among the grading levels reveal the subjectivity challenges among the radiologists in assessing the liver fat grades based on their pure radiological observations. Therefore, we can apply a univariate analysis technique to remove the outlier points. Then we can conclude applied thresholds ranges for HS severity grading, as shown in Figure 2. In addition, we were directly using another threshold from a previous study[9] to detect iron overload from the computed rSIH and rSIH/S metrics.
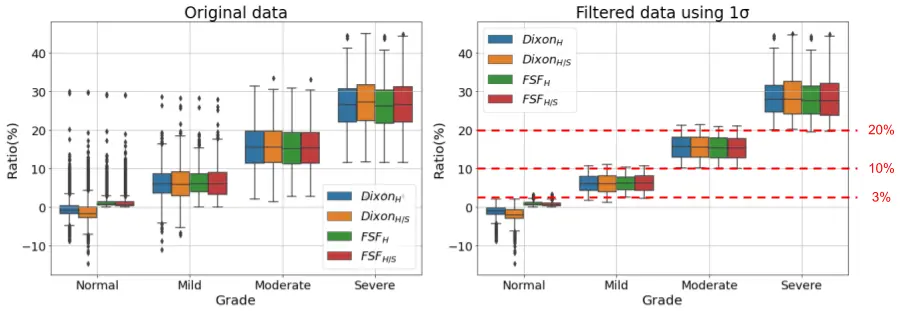
Figure 2: Box-plots of original and filtered data for the HS metrics after removing the overlapped outliers outside 1σ of the distribution range, and the concluded thresholds for grading.
Results:
The segmentation model achieves average dice scores around 96% for liver and spleen over the testing set. Figure 3 and 4 demonstrates the numerical and the visual illustration for the pipeline results. The liver fat quantification and iron detection metrics provide a numerical representation for hepatic steatosis and iron deposition across the entire liver. Meanwhile, the FSF map, and the severity pie charts provides spatial information for liver fat diffuseness, which may assist in longitudinal tracking of progression or regression of fatty liver deposition over serial scans.
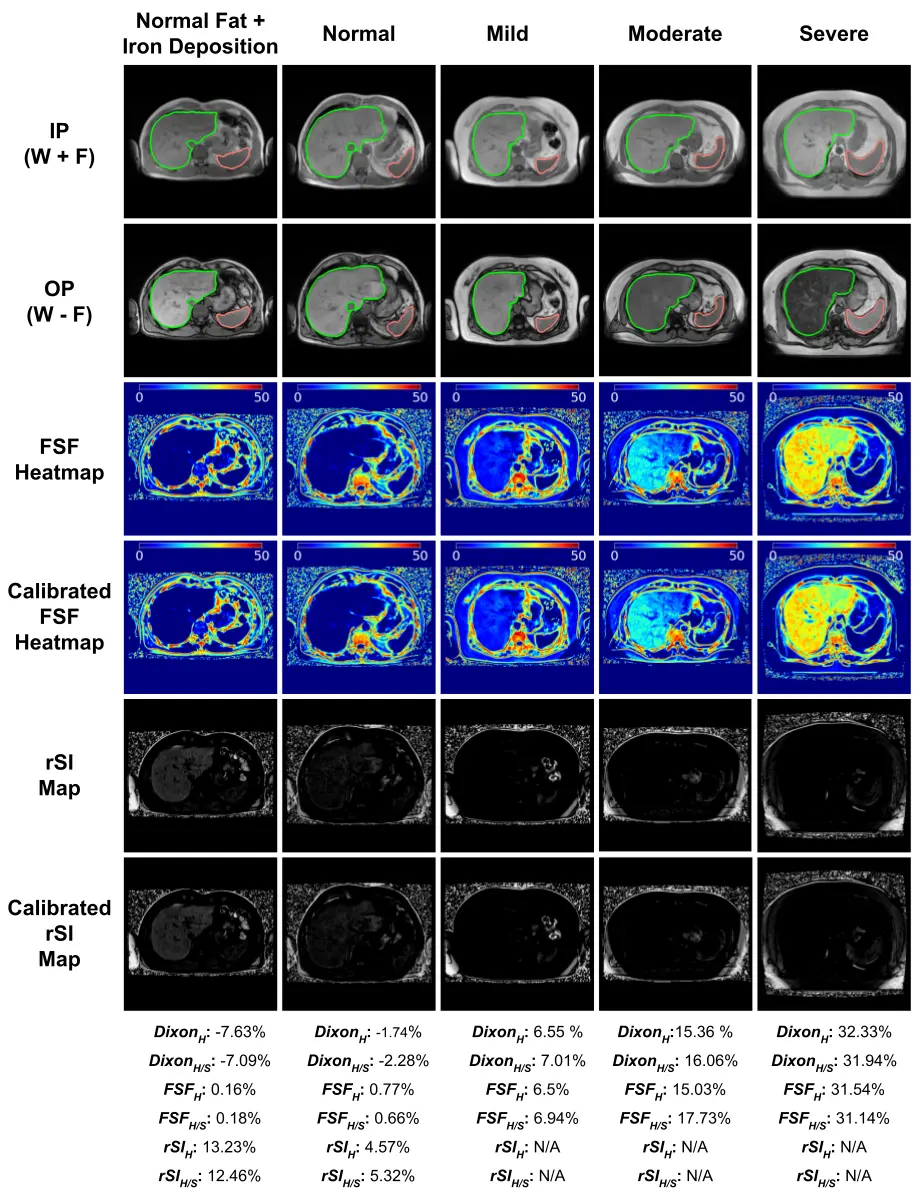
Figure 3: Visual illustration and results of the two metrics for different liver fat grades and a normal liver with iron overload. The erosion boundary of the liver and spleen segmentation masks are shown in the In-phase(IP) and opposed-phase (OP) modalities. The FSF Heatmap illustrates the hepatic steatosis diffusion. The rSI map shows the iron deposition signal.
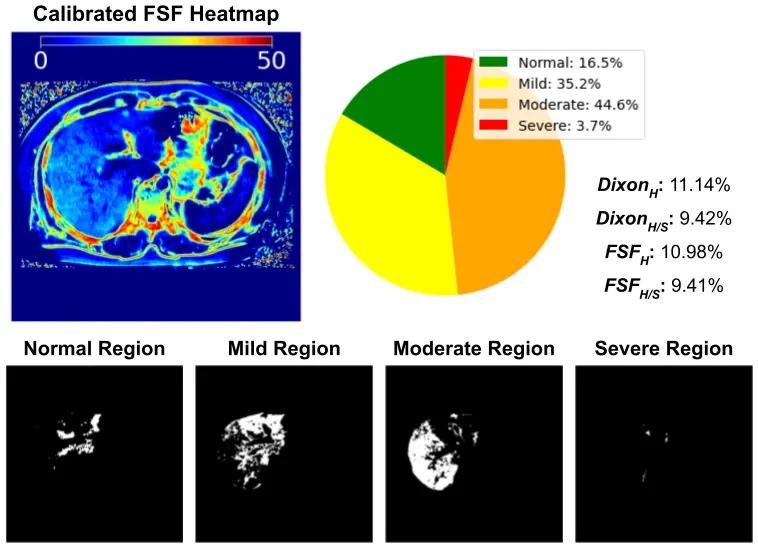
Figure 4: The pie-chart demonstrates the percentage of liver fat tissues at different severity levels.
Discussion:
The experimental results demonstrate the reproducibility of our proposed system over a large cohort dataset. We observe an incidental finding through obtaining high calibration error (DixonH/S - DixonH) for some rare conditions, due to a very dark spleen intensity in the IP modality. That shows the limitation for using the spleen as the main reference organ for calibration, and this also can be used as an indicator for abnormal spleen diagnosis.
Conclusion:
The future works may include efforts to segment out the vessels and undesired lesions like cysts/hemangiomas. Moreover, This pipeline can be modified to regionally monitor fatty distribution changes between and within individual hepatic lobes.
References:
[1] Lidia S Szczepaniak, Pamela Nurenberg, David Leonard, Jeffrey D Browning, Jason S Reingold, Scott Grundy, Helen H Hobbs, and Robert L Dobbins. Magnetic resonance spectroscopy to measure hepatic triglyceride content: prevalence of hepatic steatosis in the general population. American Journal of Physiology-Endocrinology and Metabolism, 288(2):E462–E468, 2005.
[2] AN Tang, Justin Tan, Mark Sun, Gavin Hamilton, Mark Bydder, Tanya Wolfson, Anthony C Gamst, Michael Middleton, Elizabeth M Brunt, Rohit Loomba, et al. Nonalcoholic fatty liver disease: Mr imaging of liver proton density fat fraction to assess hepatic steatosis. Radiology, 267(2):422–431, 2013.
[3] W Thomas Dixon. Simple proton spectroscopic imaging. Radiology , 153(1):189–194, 1984.
[4] Olaf Ronneberger, Philipp Fischer, and Thomas Brox. U-net: Convolutional networks for biomedical image segmentation. In International Conference on Medical image computing and computer-assisted intervention, pages 234–241. Springer, 2015.
[5] Özgün Çiçek, Ahmed Abdulkadir, Soeren S Lienkamp, Thomas Brox, and Olaf Ronneberger. 3d u-net: learning dense volumetric segmentation from sparse annotation. In International conference on medical image computing and computer-assisted intervention, pages 424–432. Springer, 2016.
[6] Scott B Reeder, Irene Cruite, Gavin Hamilton, and Claude B Sirlin. Quantitative assessment of liver fat with magnetic resonance imaging and spectroscopy. Journal of magnetic resonance imaging , 34(4):729–749, 2011.
[7] Scott B Reeder and Claude B Sirlin. Quantification of liver fat with magnetic resonance imaging. Magnetic Resonance Imaging Clinics, 18(3):337–357, 2010.
[8] Xiaozhou Ma, Nagaraj-Setty Holalkere, Mari Mino-Kenudson, Peter F Hahn, and Dushyant V Sahani. Imaging-based quantification of hepatic fat: methods and clinical applications. Radiographics , 29(5):1253–1277, 2009.
[9] JM Virtanen, TK Pudas, JA Ratilainen, JP Saunavaara, ME Komu, and RK Parkkola. Iron overload: accuracy of in-phase and out-of-phase mri as a quick method to evaluate liver iron load in haematological malignancies and chronic liver disease. The British Journal of Radiology, 85(1014):e162–e167, 2012